
Carrier & Partner Benchmarking: Why Logistics Networks Need Clear Visibility — and How Syntask Delivers It Instantly


In modern logistics operations, carriers and subcontracted partners play a central role in service quality, delivery reliability, and cost performance. Yet many companies still lack a structured way to benchmark partner performance across regions, lanes, fleet types, or customer segments. The absence of consistent measurement leads to blind spots that impact both profitability and operational reliability.
This challenge is widespread across freight forwarders, transport companies, and distribution networks. Even companies with advanced telematics or TMS systems often depend on manual spreadsheets or inconsistent KPIs to evaluate partner output. Without a unified measurement structure, decision-making becomes subjective rather than evidence-based.
Syntask addresses this gap directly through a ready-made benchmarking engine designed for logistics networks.
Why Partner Performance Is Difficult to Benchmark
Benchmarking a partner seems simple in theory: compare on-time rates, cost, quality, and reliability. However, in real logistics networks, several complexities arise.
1. Differences in Regions, Lanes, and Vehicle Types
A carrier working on a short-distance urban route cannot be compared directly with one delivering long-haul freight.
Likewise:
- road conditions
- customer expectations
- fuel requirements
- loading behavior
- traffic patterns
all vary across regions. Traditional BI tools require custom modeling for each comparison, which can take weeks.
2. Inconsistent Data Formats from Different Partners
Partner A reports:
- delivery times
- delays
- capacity
Partner B sends:
- invoices
- vehicle type
- fuel impact
Partner C only provides a PDF summary. Data must be normalized before any comparison can occur — something BI tools cannot automate.
3. Lack of Common KPIs Across the Network
Most logistics organizations struggle with KPI standardization. Different teams measure:
- on-time performance
- cost per trip
- empty kilometers
- damage rates
- driver behavior
but often using different formulas. As a result, two departments may report conflicting performance values for the same partner.
4. Manual Comparison Consumes Significant Time
In Power BI, Tableau, or Oracle BI, analysts need to:
- merge regional data
- clean inconsistencies
- create shared KPIs
- segment trips
- build dashboards
This is labor-heavy and rarely feasible for weekly or daily operations.
The Business Impact of Poor Partner Visibility
Operating without clear partner benchmarking leads to several risks:
• Unfair or inaccurate carrier evaluations
Some partners appear underperforming simply because their data is incomplete.
• Misaligned cost and service expectations
A partner may charge more but deliver better quality — or the opposite.
• Declining customer experience
Poor-performing carriers directly affect delivery reliability and brand reputation.
• Strategic misallocation
Companies may continue using ineffective partners simply because issues are invisible.
• Difficulty scaling to new regions
Without comparison metrics, expansion decisions lack clarity. Benchmarking is more than a performance review — it is a foundation for network efficiency.
How Syntask Solves Carrier & Partner Benchmarking Automatically
Syntask is designed around logistics-specific data logic. The platform includes a predefined benchmarking framework that eliminates the need for custom BI modeling. Companies can upload partner data via Excel or connect through API. The system instantly creates a unified, comparable performance view.
1. Standardized KPI Framework for All Partners
Syntask automatically calculates:
- on-time delivery rate
- cost per km
- cost per ton
- trip reliability
- empty km ratio
- fuel efficiency
- capacity usage
- damage or exception rate
All KPIs follow the same formulas across the entire network — removing inconsistencies.
This ensures that:
- regional comparisons are fair
- partner differences are accurate
- decisions rely on objective data
2. Performance Segmentation by Region, Lane, and Customer Type
Syntask groups partners automatically:
- by region
- by lane
- by vehicle class
- by customer segment
- by shipment type
This creates apples-to-apples comparisons rather than broad averages.
Examples:
- “Carrier X performs well on long-haul but weak on short-haul.”
- “Partner B is slow in the Ankara region but efficient in Izmir.”
- “Carrier C has the lowest cost-per-ton in refrigerated shipments.”
These insights are ready in minutes, not days.
3. Multi-Dimensional Benchmark Score
Syntask generates a combined score based on:
- cost
- reliability
- fuel impact
- delivery performance
- operational consistency
This provides a clear ranking of partners at any moment. Leaders and underperformers become immediately visible.
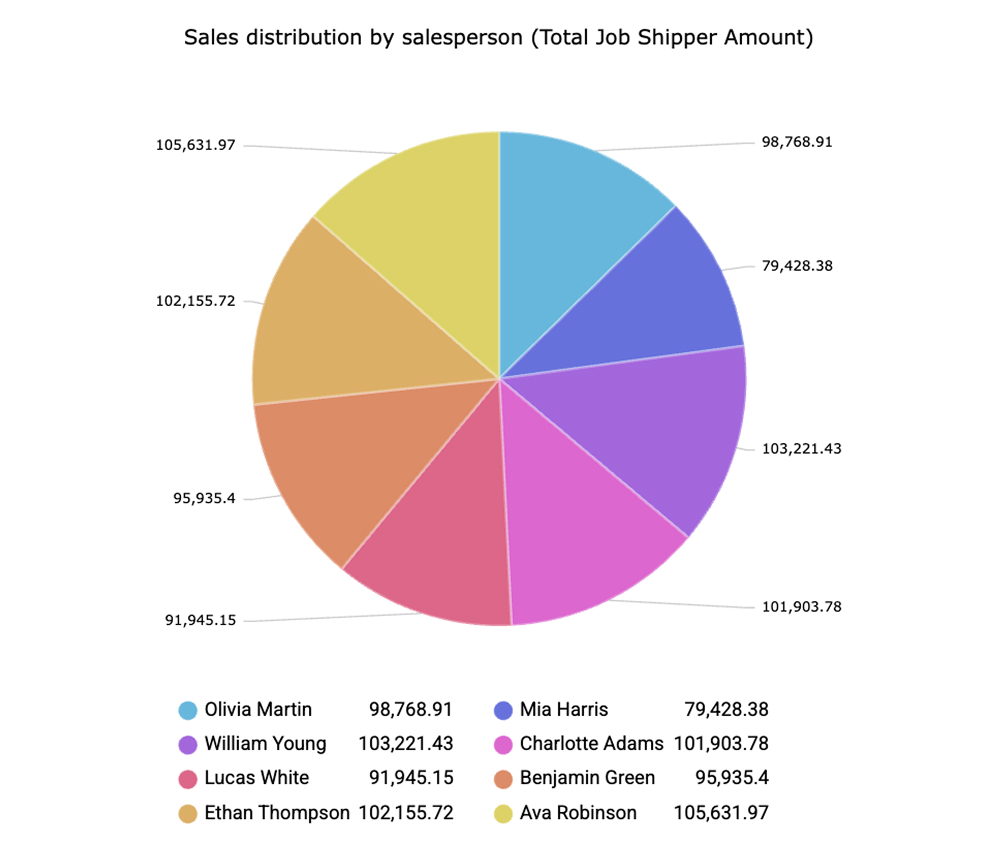
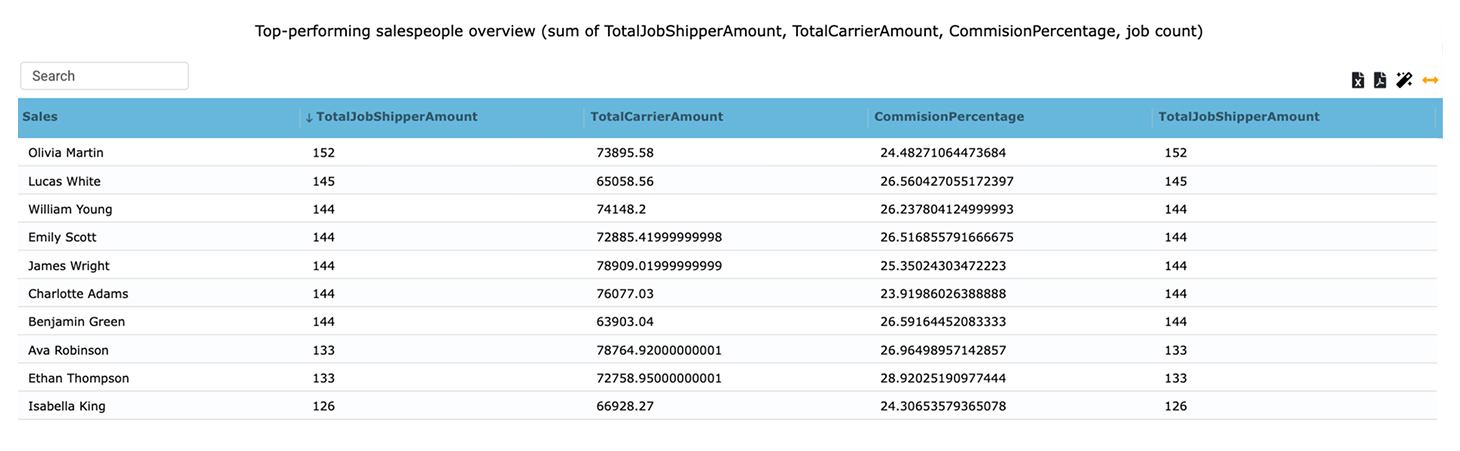
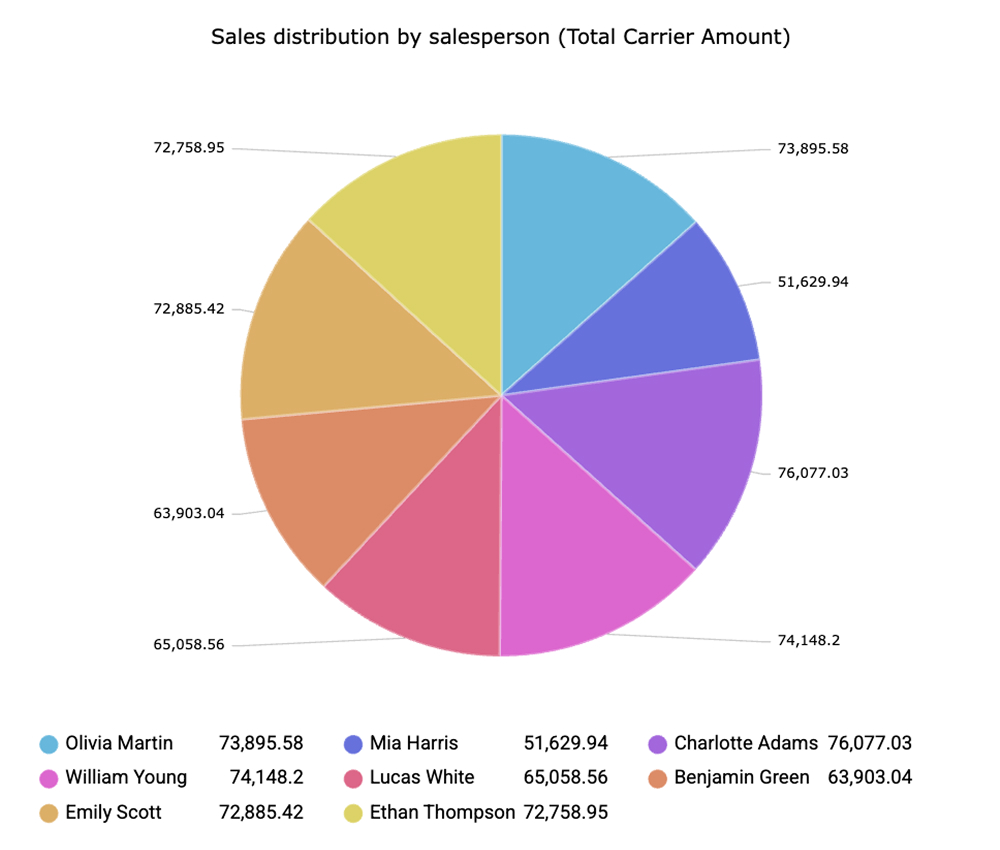
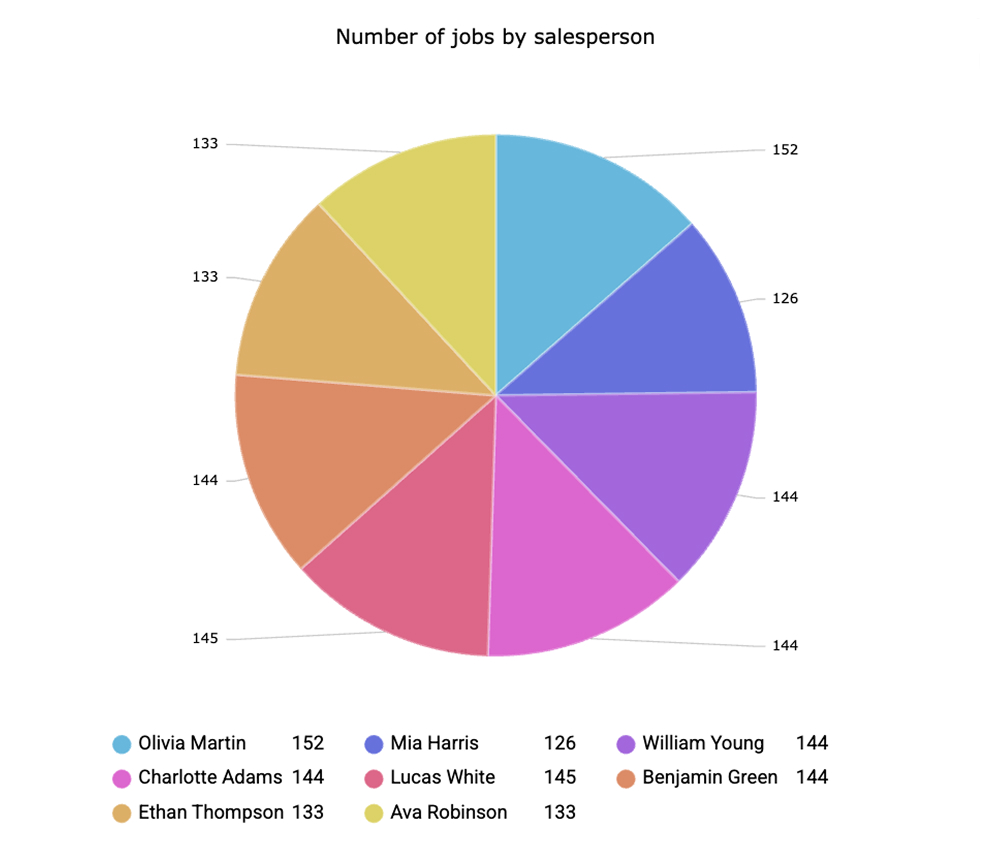
4. Visual Dashboards With Instant Comparison
The platform provides:
- comparison charts
- regional performance maps
- trend lines
- exception clusters
- cost impact graphs
Decision-makers instantly see patterns across partners. This prevents operational issues from reaching the customer.
5. Chat Agent for Deep-Dive Explanations
Users can ask:
- “Which carrier performed best in the Istanbul region last quarter?”
- “Show me partners with high empty-km ratios.”
- “Why is Partner A underperforming this month?”
Syntask responds with analytics, context, and visuals — without manual querying or model building.
Measurable Benefits for Logistics Companies
Syntask delivers several practical advantages:
• Improved partner selection
Companies identify carriers who deliver high quality at reasonable cost.
• Better contract negotiations
Benchmarking makes pricing discussions data-driven.
• Reduced operational risk
Underperformers are detected early.
• Predictable customer service
Reliable partners strengthen the entire logistics chain.
• Scalable multi-region visibility
As networks grow, comparisons remain consistent. Syntask replaces subjective judgment with operational evidence.
Conclusion
Carrier and partner performance benchmarking is essential for building a reliable transportation network. Traditional BI tools make benchmarking complex, slow, and dependent on technical expertise. Syntask provides a logistics-focused benchmarking engine that works instantly, with standardized metrics and automated comparisons.
With unified KPIs, real-time insights, and a built-in chat analysis layer, Syntask enables logistics companies to evaluate partners fairly, improve network reliability, and make informed operational decisions.